Troubleshooting and Maintenance
Overview
The Troubleshooting and Maintenance section provides diagnostic and maintenance controls for the DeskAlerts 12 server environment. It is intended for use by system administrators and support engineers when investigating system issues, diagnosing delivery failures, or performing routine platform maintenance.
Settings in this section affect server-side behavior, log output volume, and the visibility of internal error information. They do not affect alert delivery or recipient experience directly, but misconfiguration can impact system performance, disk usage, or unintentionally expose sensitive system details.
Warning: Several settings in this section are intended for active troubleshooting only. Disable verbose options and extended error output as soon as an investigation is complete.
Navigation
The Troubleshooting group of the Settings menu contains two pages:
| Page | Description |
|---|---|
| Extended error screens | Controls whether detailed technical error information is shown in the web portal when a server fault occurs |
| Logging | Shows which log levels are active, sets how long log files are retained on the server, and downloads a diagnostics bundle for DeskAlerts support |
Extended error screens
Overview
Extended error screens controls whether the DeskAlerts web portal displays detailed technical error output when an unhandled server fault or application exception occurs.
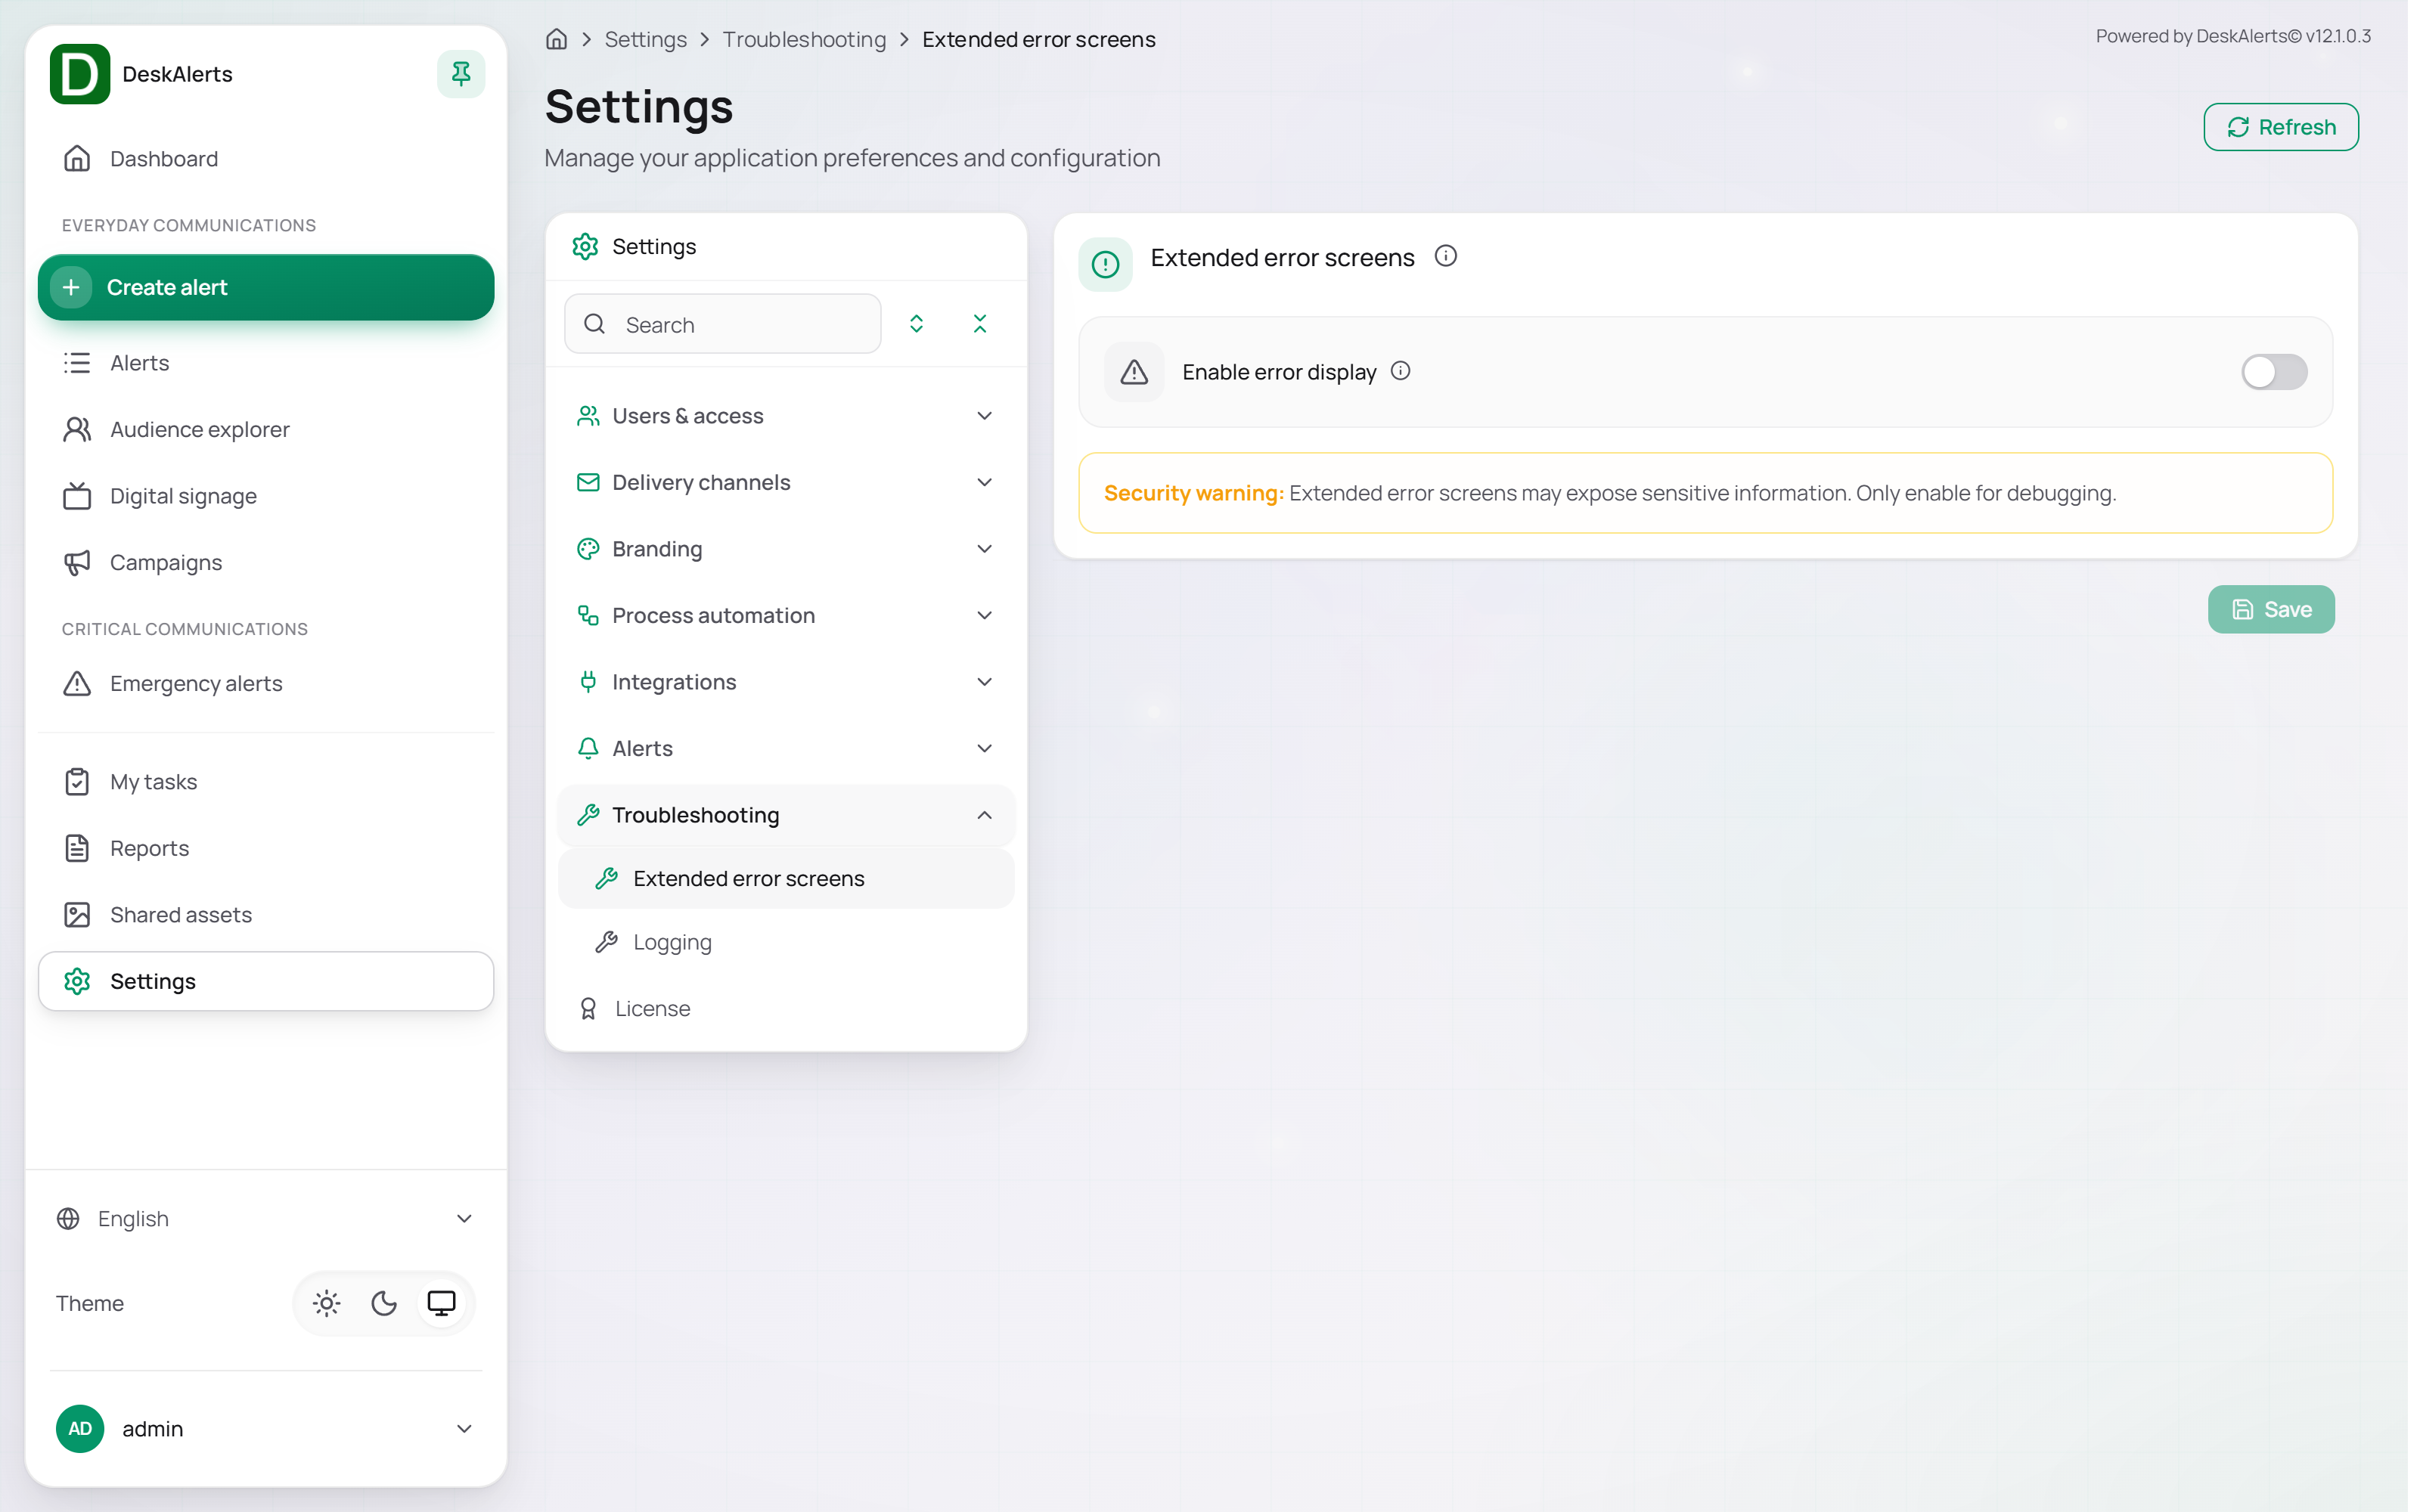 Extended error screens
Settings
| Setting | Description |
|---|---|
| Enable error display | When enabled, error pages in the web portal display detailed diagnostic information, including stack traces, exception types, and internal component references. When disabled, a generic error message is shown with no technical detail. |
The page displays a persistent security warning regardless of the current switch state:
Security warning: Extended error screens may expose sensitive information. Only enable for debugging.
Click Save to apply changes.
Behavior
| State | Behavior |
|---|---|
| Disabled (default) | Error pages display a generic message. No internal system detail is exposed. Recommended for all production environments. |
| Enabled | Error pages display full diagnostic output including stack traces, exception messages, and internal identifiers. Intended for active troubleshooting sessions only. |
Operational Notes
- Enable this setting only during an active investigation. Disable it immediately once the issue is resolved.
- When enabled, detailed error output is visible to any web-portal user who encounters an error — not only administrators.
- Extended error output may contain server file paths, component names, and internal configuration references. Do not share screenshots of extended error pages externally without first reviewing the content.
- This setting should not remain enabled in any shared or customer-facing production environment outside of a controlled maintenance window.
Logging
Overview
Logging shows which log severity levels are recorded by the DeskAlerts server, sets how long log files are retained, and provides the Diagnostics bundle for support cases.
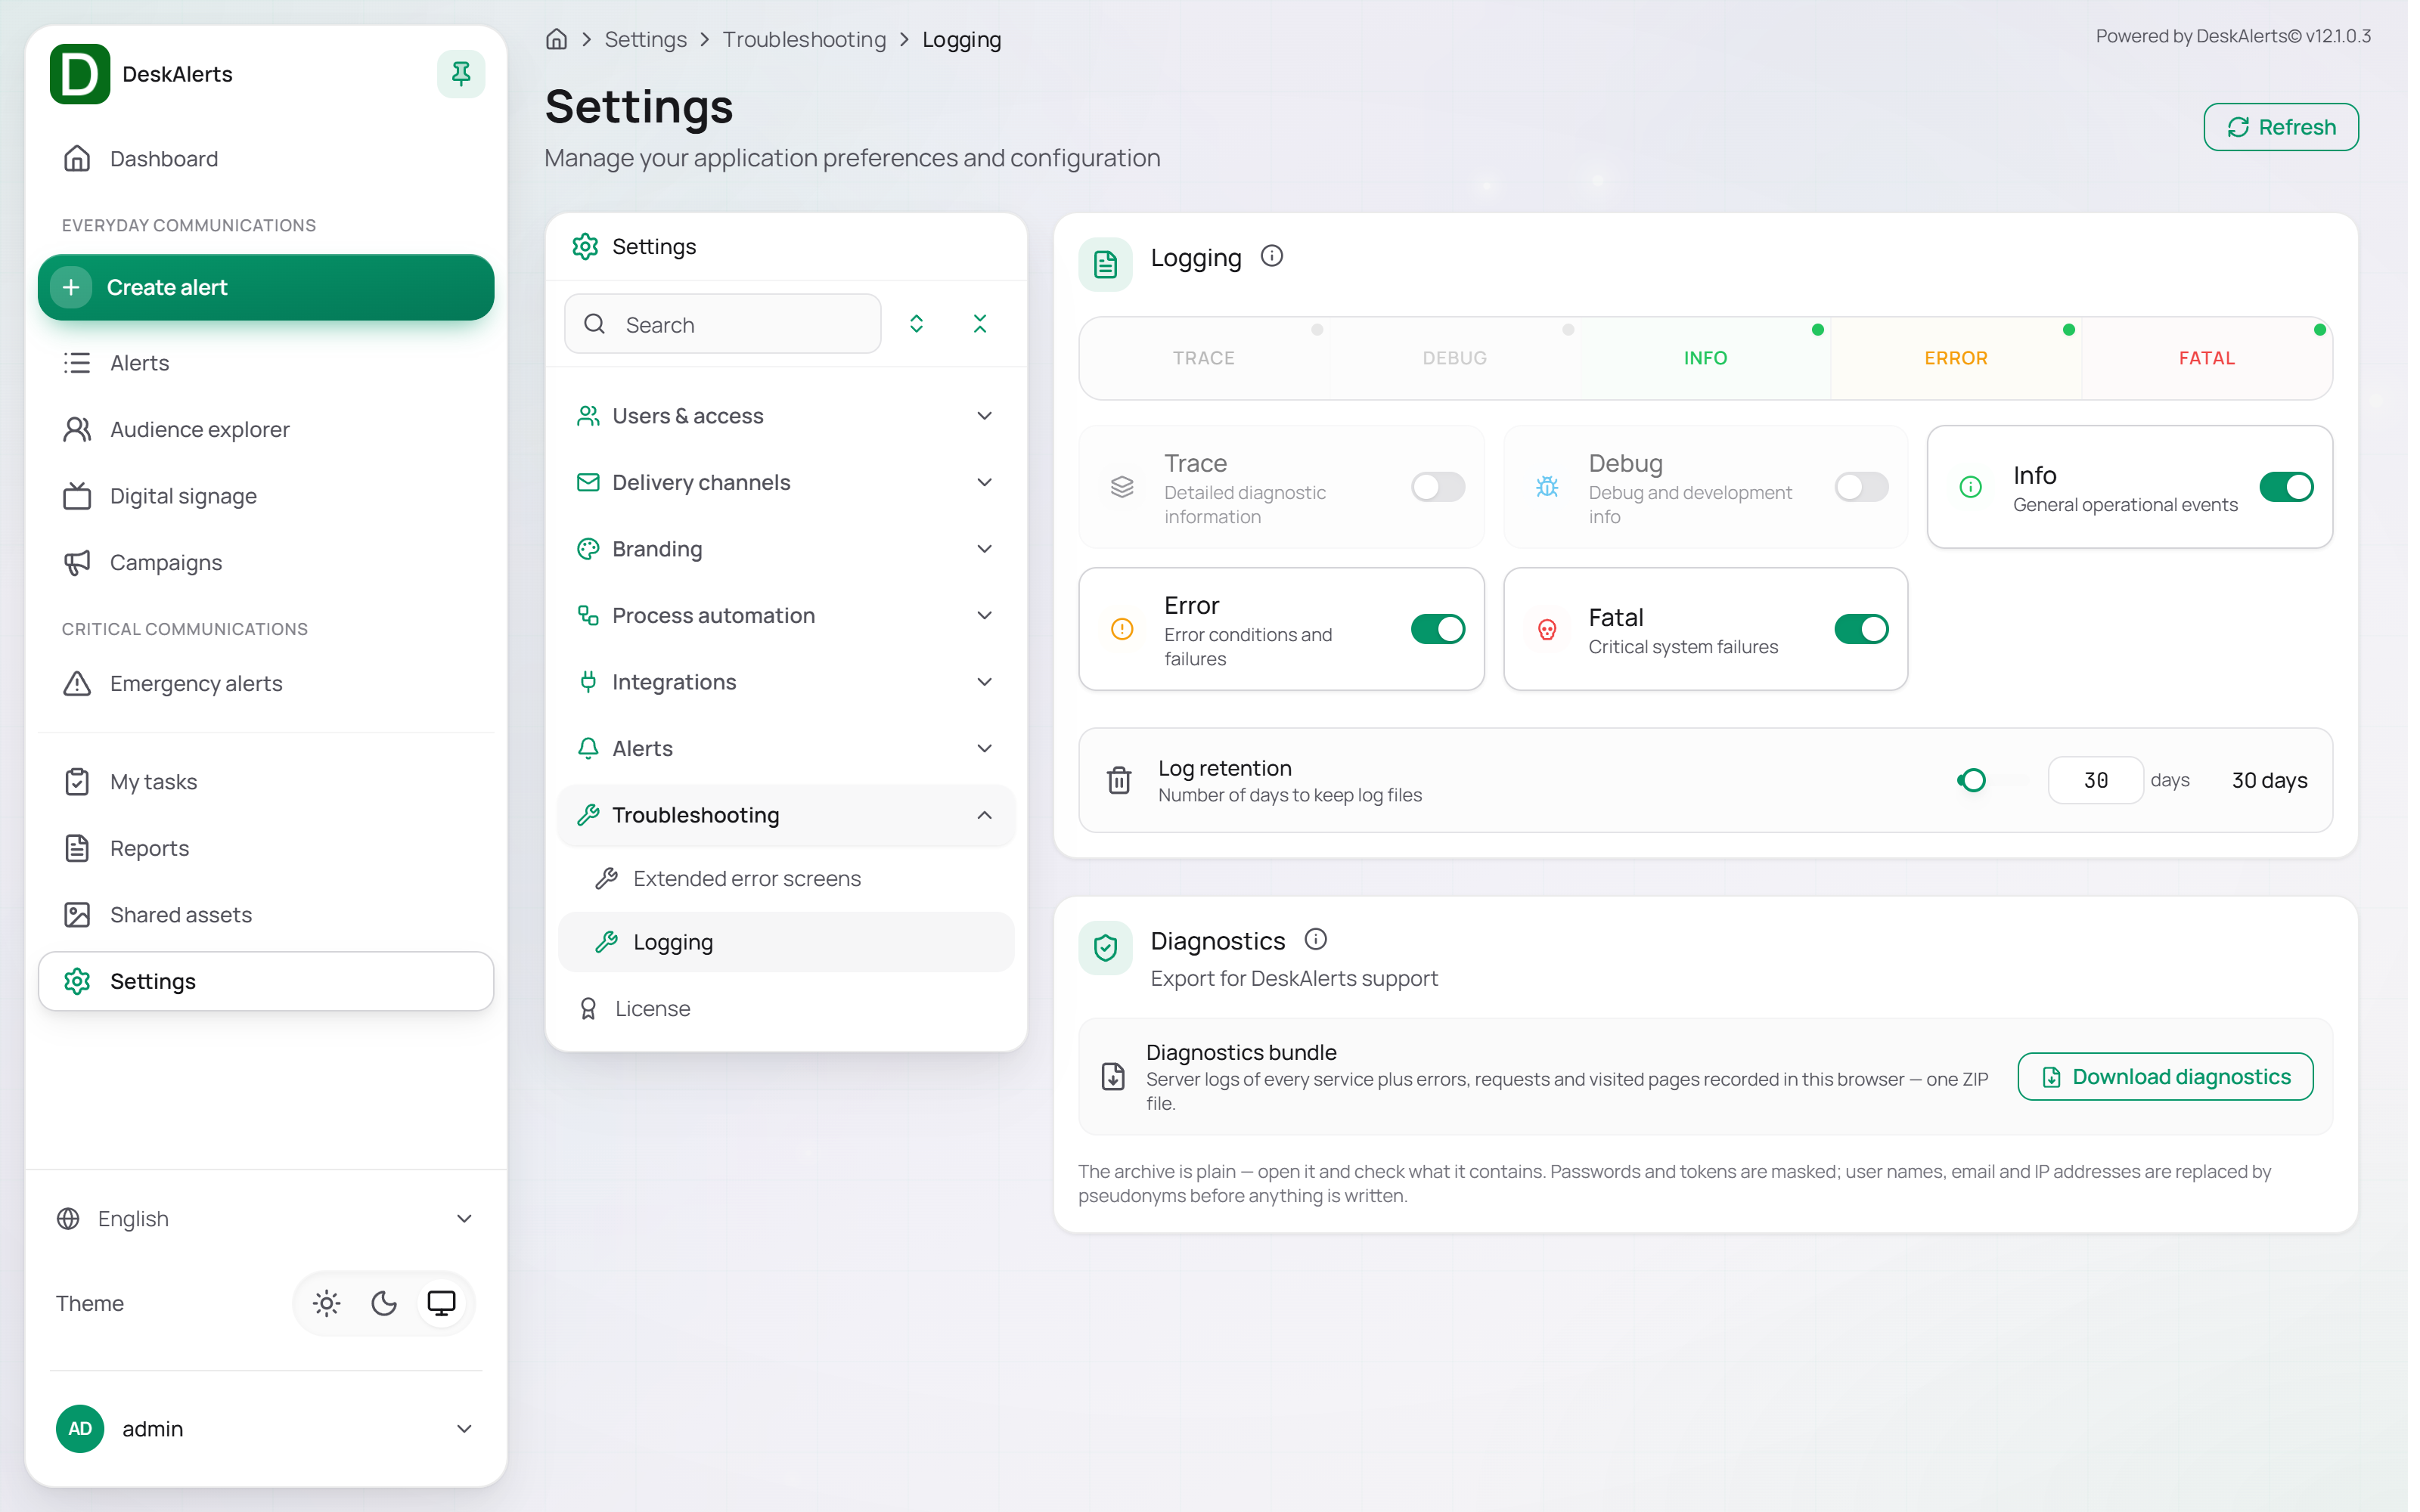 Logging — log levels, Log retention, and Diagnostics
Page layout
The page is organized into three areas:
| Area | Description |
|---|---|
| Log levels | The five log levels, each with a short description of what it captures |
| Log retention | A configurable retention period that controls how long log files are kept on the server before automatic deletion |
| Diagnostics | Downloads a diagnostics bundle for DeskAlerts support |
The five log levels are also represented as a bar across the top of the page — TRACE, DEBUG, INFO, ERROR, and FATAL.
Log levels
All five levels are independent; a higher-severity level does not automatically enable lower-severity levels.
| Level | Description | Default |
|---|---|---|
| Trace | Detailed diagnostic information. Records granular internal activity including component interactions, data flow, and low-level execution steps. Highest output volume. | Enabled |
| Debug | Debug and development information. Records internal state, variable values, and decision logic useful during active debugging. | Enabled |
| Info | General operational events. Records normal system activity such as sync completions, alert dispatches, and user logins. | Enabled |
| Error | Error conditions and failures. Records faults that affect specific operations but do not prevent the system from continuing to run. | Enabled |
| Fatal | Critical system failures. Records severe errors that cause a process or service to terminate unexpectedly. | Enabled |
All five levels are on in a new installation; with Trace and Debug on, about nine of ten lines in the Main Service log are at these two levels.
Note: To change the log levels, contact DeskAlerts support.
Log retention
The Log retention setting controls how long DeskAlerts keeps server log files before they are automatically deleted.
| Setting | Description |
|---|---|
| Number of days to keep log files | The number of days to retain log files. The default value is 30 days. |
Log files older than the configured period are removed automatically.
Note: Coordinate with your infrastructure or storage team when extending the retention period on servers with limited disk allocation. Verbose logging combined with long retention can consume significant disk space over time.
Diagnostics
The Diagnostics card — Export for DeskAlerts support — packages everything support usually asks for into one ZIP file.
| Element | Description |
|---|---|
| Diagnostics bundle | Server logs of every service plus the errors, requests, and visited pages recorded in the current browser session |
| Download diagnostics | Builds the bundle and downloads it |
The archive is plain — open it and check what it contains before sending it. Passwords and tokens are masked, and user names, e-mail addresses, IP addresses, and host names are replaced by pseudonyms (email-1, ip-5, host-1 …) before anything is written to the bundle; manifest.json lists how many values were replaced. Free text such as alert titles is not changed.
What the server part contains: server-logs.json with the log files of every service (Authentication, Connection, Main, Workflows, Reports, AI, SMTP, Settings), each file cut to its most recent ~1,000 lines. With Trace and Debug on, that covers only about the last 15 minutes of the Main Service. Download the bundle right after reproducing the problem, and send the full log files from the deskalerts-logs volume when support needs a longer period.
Recommended logging practices
- Set a log retention period appropriate for your environment. 30 days is a reasonable default for most deployments. Shorter retention may be appropriate for high-volume environments; longer retention may be required for audit or compliance purposes.
- When capturing logs for a support case, download the Diagnostics bundle right after reproducing the problem — see How-to: Prepare a support request.
Related settings
| Setting | Location | Relevance |
|---|---|---|
| AD sync logging | Settings → Users & access → IAM sync settings | Dedicated debug, error, and trace controls scoped to Active Directory synchronization |
| Azure sync logging | Settings → Users & access → IAM sync settings | Dedicated debug, error, and trace controls scoped to Microsoft Entra ID synchronization |
| Enable SMTP logging | Settings → Delivery channels → SMTP server (emails) | Session-level logging for outbound email delivery troubleshooting |
| Inbound API | Settings → Integrations → Inbound API | API access controls; relevant when investigating inbound integration failures |