Dashboard
Overview
The Dashboard is the first page you see after signing in to the DeskAlerts web portal. It gives administrators and publishers an at-a-glance view of the system: how many endpoints are connected right now, how many recipients received alerts in the selected period, which agent versions are deployed, which approvals are waiting for you, and one-click shortcuts to create everyday alerts or send an emergency alert template.
The Dashboard is built from widgets. A new account starts with an empty dashboard (Your dashboard is empty — Add widgets to personalize your dashboard and keep track of what matters most); you choose which widgets to show, and your selection and layout are saved for your account and restored the next time you open the Dashboard.
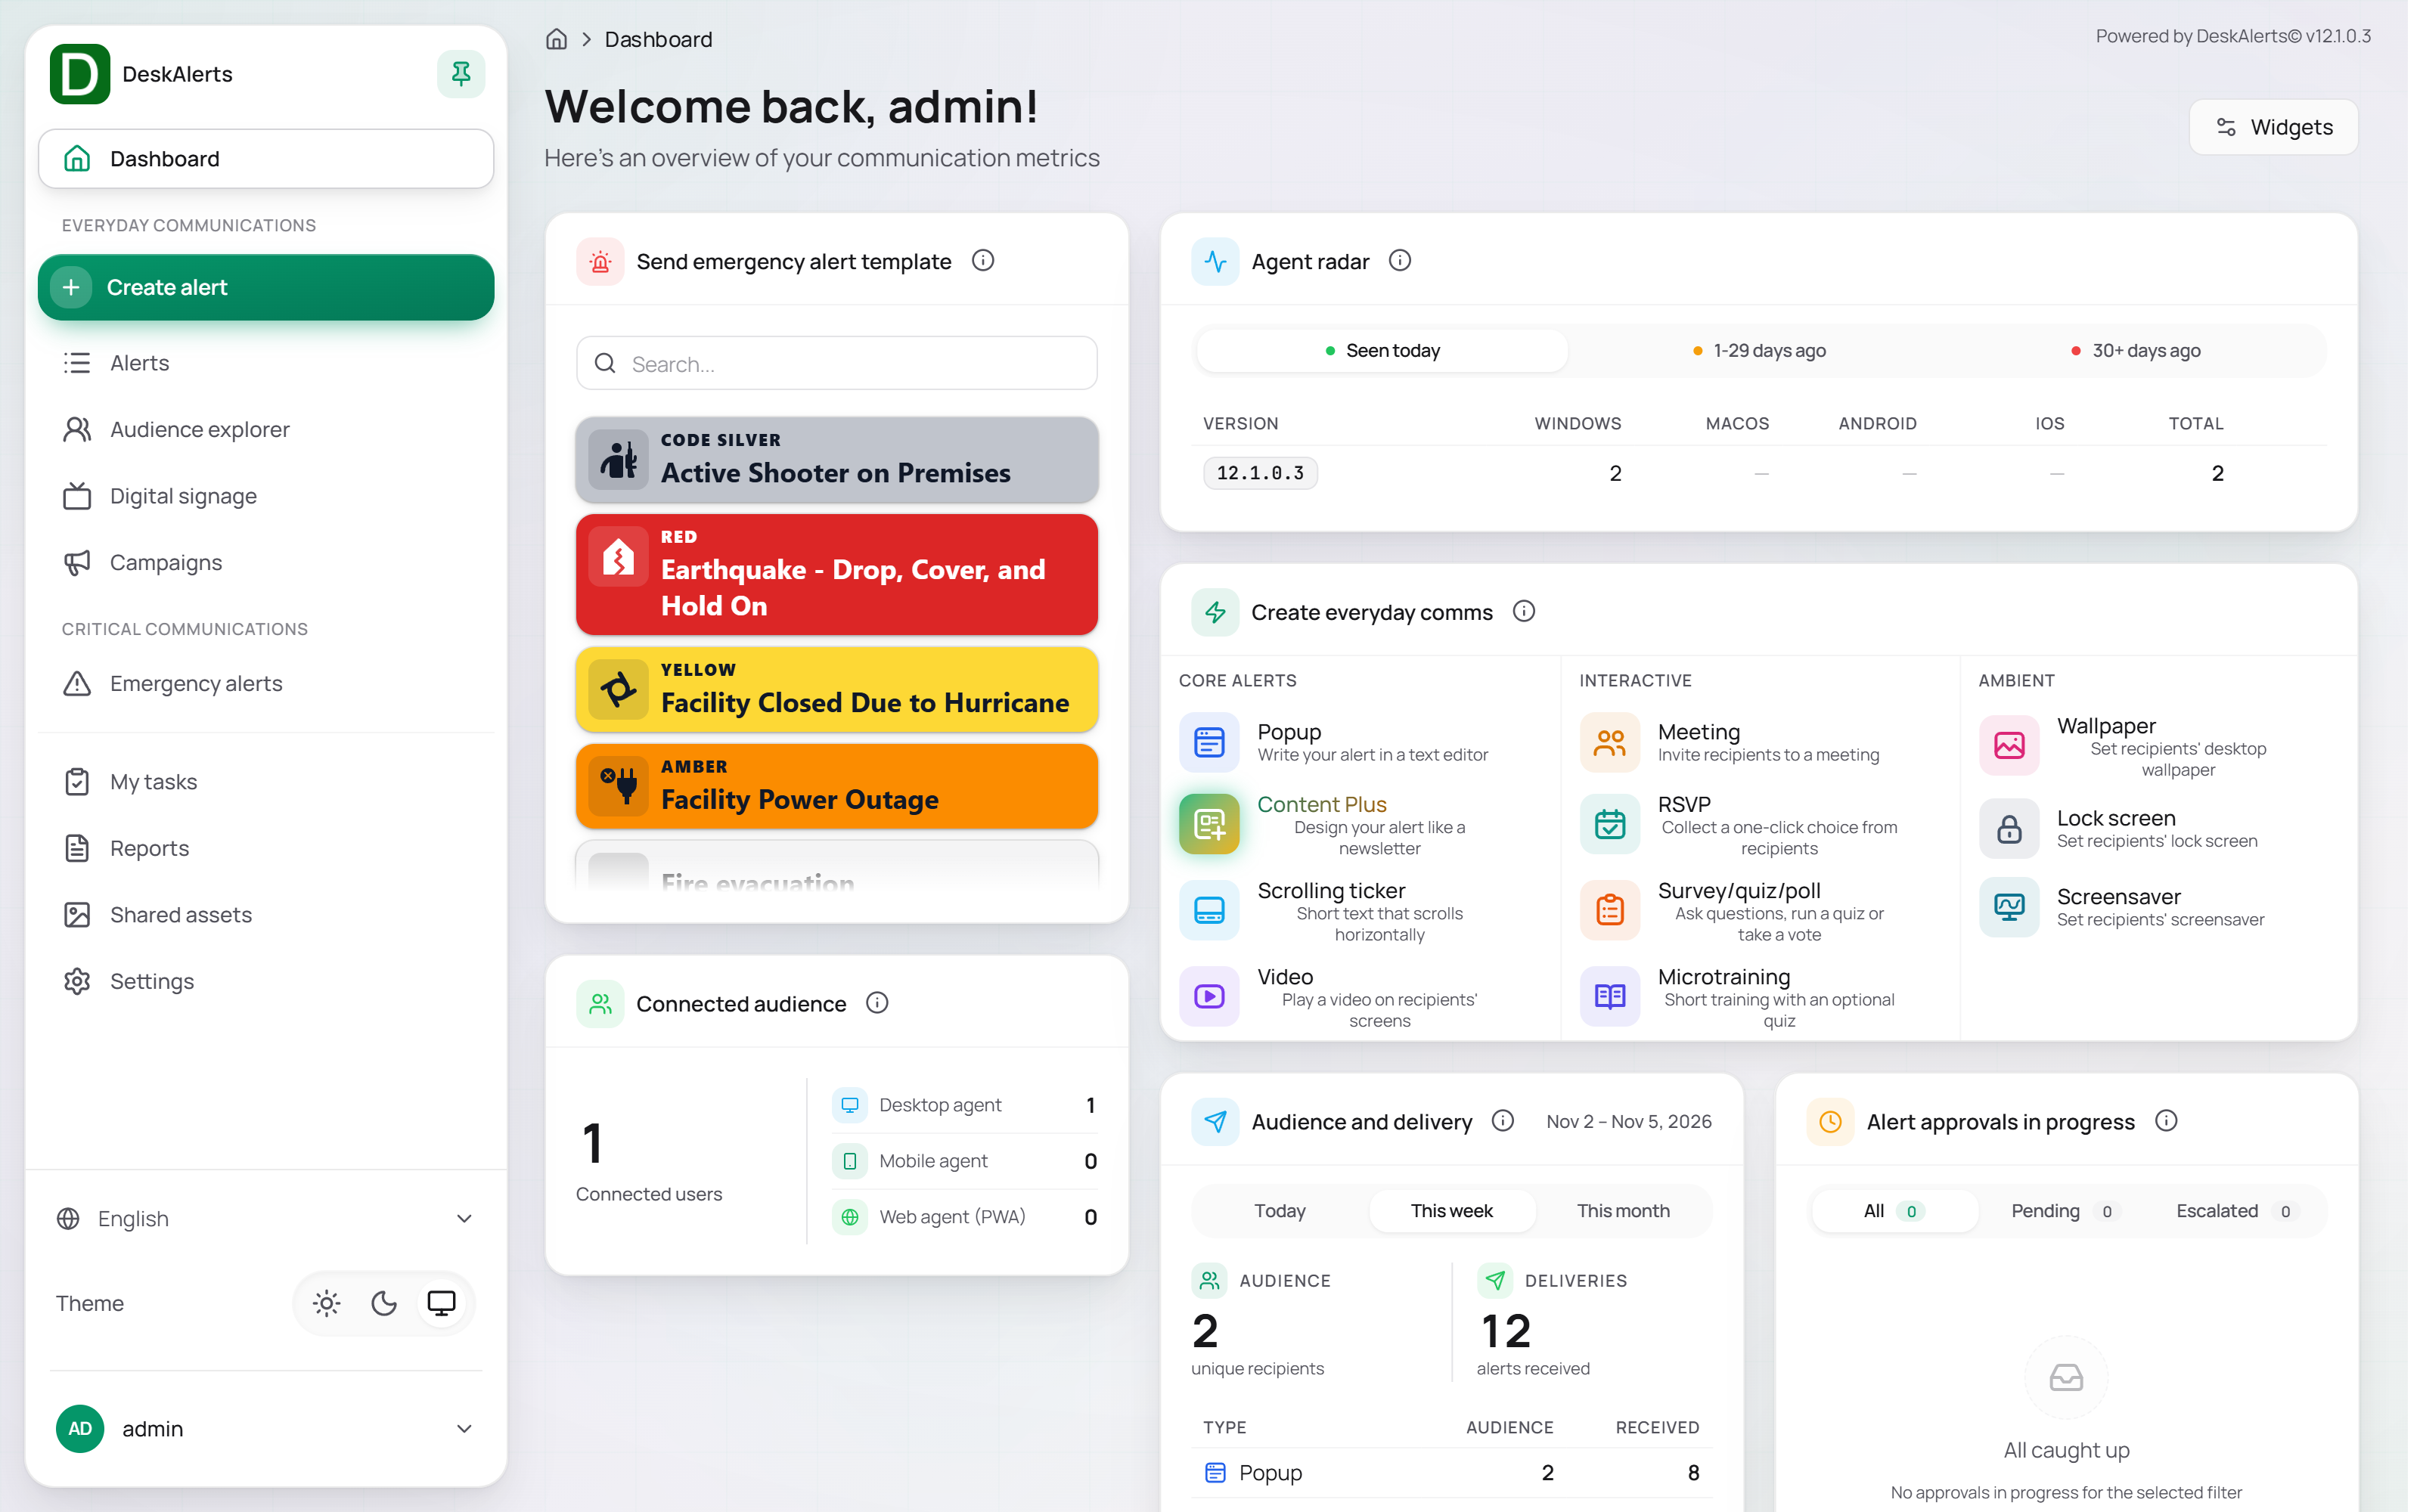 The Dashboard of the administrator with all six widgets enabled
Note: The screenshots in this section were taken on a demonstration server with a single connected desktop agent, so most counters show small numbers or
—. On a live system these values reflect your actual audience and delivery data.
Page layout
| Area | Description |
|---|---|
| Breadcrumb | Shows the current location (Home › Dashboard). Click the home icon on any page to return to the Dashboard |
| Page header | Greets the signed-in user (Welcome back, <login>!) |
| Build label | The top-right corner shows the DeskAlerts build number (for example, v12.1.0.3) — useful when contacting support |
| Widgets | Opens the Widget settings dialog where you add and remove widgets. See Customizing the Dashboard |
| Widget area | The main content area containing the enabled widgets |
The left navigation panel and the controls at its bottom are described in Global navigation and user account.
Dashboard widgets
DeskAlerts 12 includes six widgets:
| Widget | Purpose |
|---|---|
| Emergency alerts (shown as Send emergency alert template) | Send an emergency alert template with one click and monitor active emergency alerts |
| Connected audience | Live count of signed-in audience users on desktop, mobile and web (PWA) agents |
| Agent radar | Rollout of the v12 agent versions by platform and recency |
| Create everyday comms | Shortcuts to create every type of everyday alert |
| Audience and delivery | Unique recipients and alert deliveries by type for a selected period |
| Alert approvals in progress | Pending and escalated approval requests |
Each widget has an ⓘ icon next to its title; hover over it to see a short description of the widget's data.
Send emergency alert template
This widget lists the emergency alert templates configured on the Emergency alerts page, so an operator can send one without leaving the Dashboard.
| Element | Description |
|---|---|
| Search | Filters the template list by title as you type |
| Template card | One card per emergency alert template. The color stripe and label (RED, AMBER, YELLOW, CODE RED, EVACUATE, …) show the color code assigned to the template on the Emergency alerts page |
| Tap to send | Click a card to send the template to its preconfigured recipients |
Important: Sending an emergency alert template from the Dashboard uses the recipients, content, and delivery options saved in the template. Review the template on the Emergency alerts page before relying on the one-click shortcut. Whether the button sends at once or asks for a second tap is set under Settings → Alerts → Emergency alerts → Activation — see Alert appearance and Emergency alerts.
Connected audience
Shows the endpoints connected to the server right now.
| Element | Description |
|---|---|
| Connected users | Total number of endpoints currently connected |
| Desktop agent | Connected desktop agents (Windows and macOS) |
| Mobile agent | Connected mobile apps (Android and iOS) |
| Web agent (PWA) | Connected web clients |
Agent radar
Shows how many endpoints per platform are running each version of the v12 agent, grouped by when the endpoint was last seen. Use it to track the rollout of a new agent version and to spot endpoints that have not connected for a long time.
| Element | Description |
|---|---|
| Recency filter | Seen today, 1-29 days ago, or 30+ days ago — when the endpoints were last connected |
| Version | The agent version number (for example, 12.1.0.3) |
| Windows / macOS / Android / iOS | Number of endpoints on each platform running that version |
| Total | Total endpoints running that version |
Platforms with no endpoints on a version show a dash.
Create everyday comms
Quick access to the alert creation page for each alert type. The tiles are grouped into three categories:
| Category | Alert type | Description |
|---|---|---|
| Core alerts | Popup | Write your alert in a text editor |
| Content Plus | Design your alert like a newsletter | |
| Scrolling ticker | Short text that scrolls horizontally | |
| Video | Play a video on recipients' screens | |
| Interactive | Meeting | Invite recipients to a meeting |
| RSVP | Collect a one-click choice from recipients | |
| Survey/quiz/poll | Ask questions, run a quiz or take a vote | |
| Microtraining | Short training with an optional quiz | |
| Ambient | Wallpaper | Set recipients' desktop wallpaper |
| Lock screen | Set recipients' lock screen | |
| Screensaver | Set recipients' screensaver |
Click a tile to open the creation page for that alert type. The same shortcuts are available in the Create alert menu of the navigation panel and at the top of the Alerts page. See Alerts for a description of each alert type and the creation page.
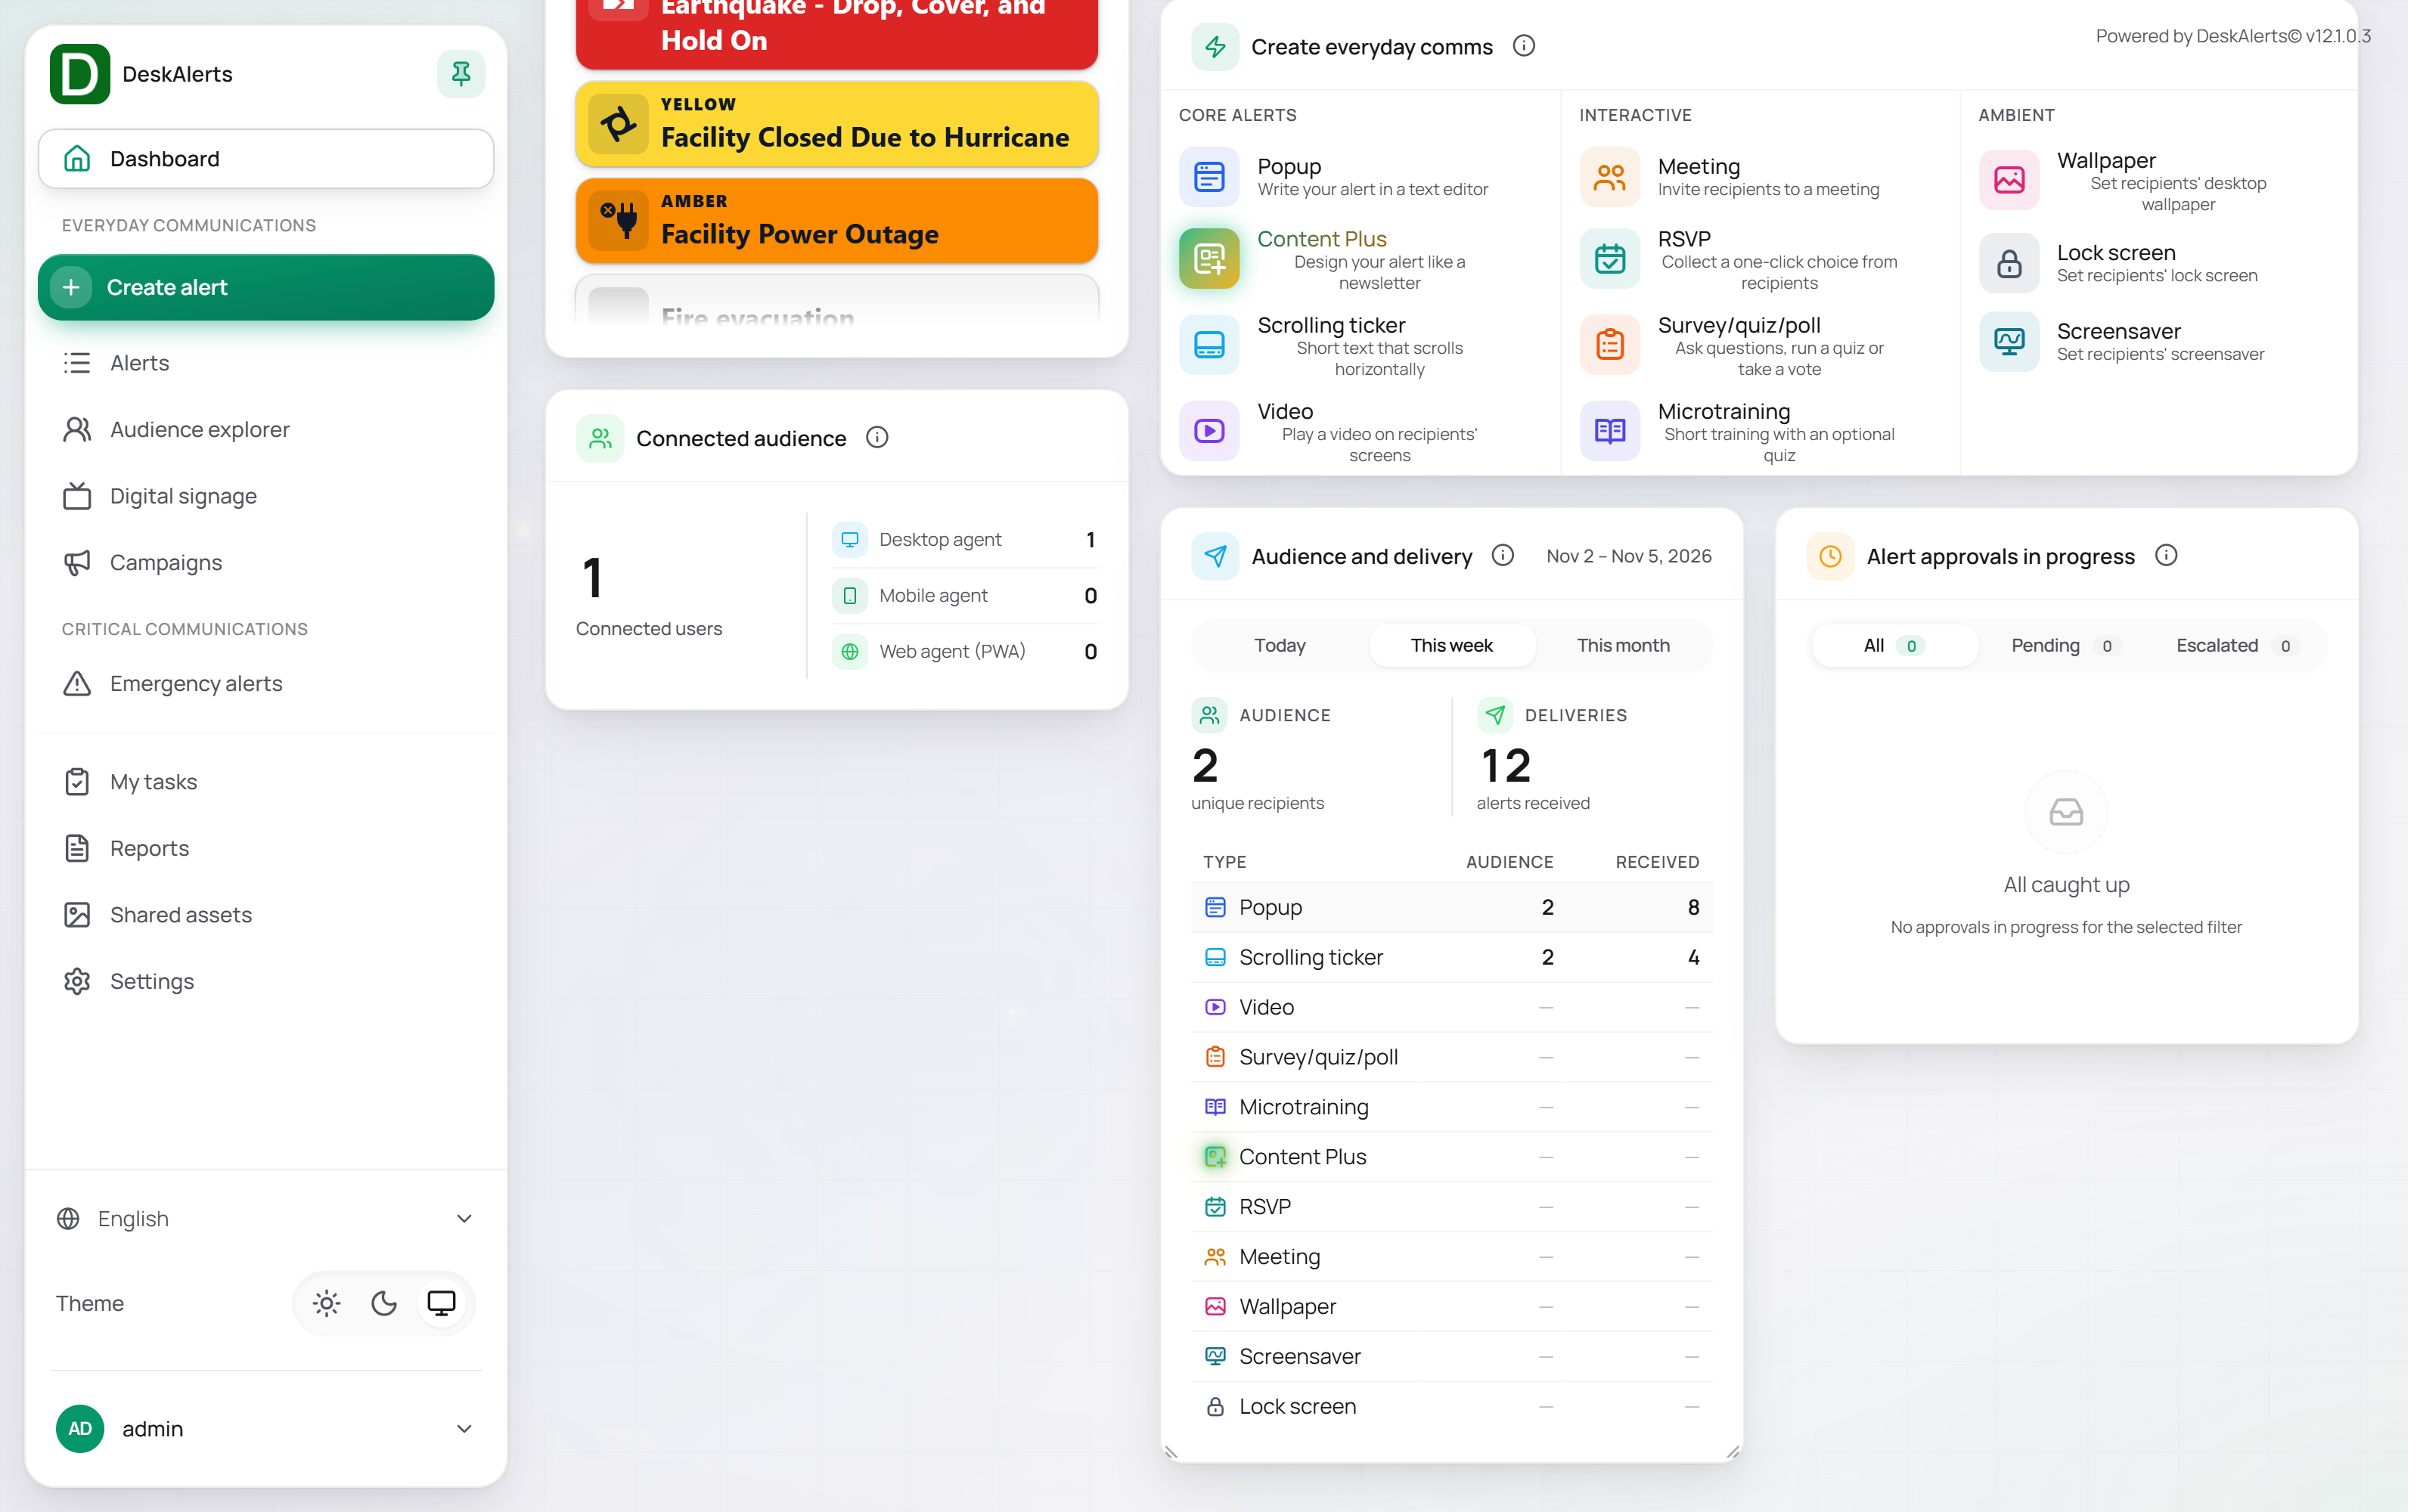 Create everyday comms, Audience and delivery, Alert approvals in progress
Audience and delivery
Shows how many unique recipients received alerts and how many alerts were delivered in the selected period, broken down by alert type.
| Element | Description |
|---|---|
| Period selector | Today, This week, or This month. The exact date range is shown in the widget header (for example, Nov 2 – Nov 5, 2026) |
| Audience | Number of unique recipients that received at least one alert in the period |
| Deliveries | Total number of alerts received in the period |
| Type table | Audience and deliveries for each alert type. A dash (—) means no alerts of that type were delivered in the period |
For detailed delivery statistics, use the Reports page.
Alert approvals in progress
Shows approval requests in progress, so you can act on them without opening My tasks.
| Element | Description |
|---|---|
| All | All approval requests in progress, with a counter |
| Pending | Requests waiting for a decision, with a counter |
| Escalated | Requests that were escalated according to the approval workflow, with a counter |
| Request list | One row per alert awaiting approval, with the alert type and the sender |
Approval workflows are configured under Settings → Process automation. See Process automation.
Customizing the Dashboard
Adding and removing widgets
- Click Widgets in the top-right corner of the page (or Add widgets on an empty dashboard).
- In the Widget settings dialog, click Add under a widget to show it on the Dashboard, or Remove to hide it. The dialog header shows how many widgets are active (for example,
· 6 active). - Close the dialog. The Dashboard updates immediately.
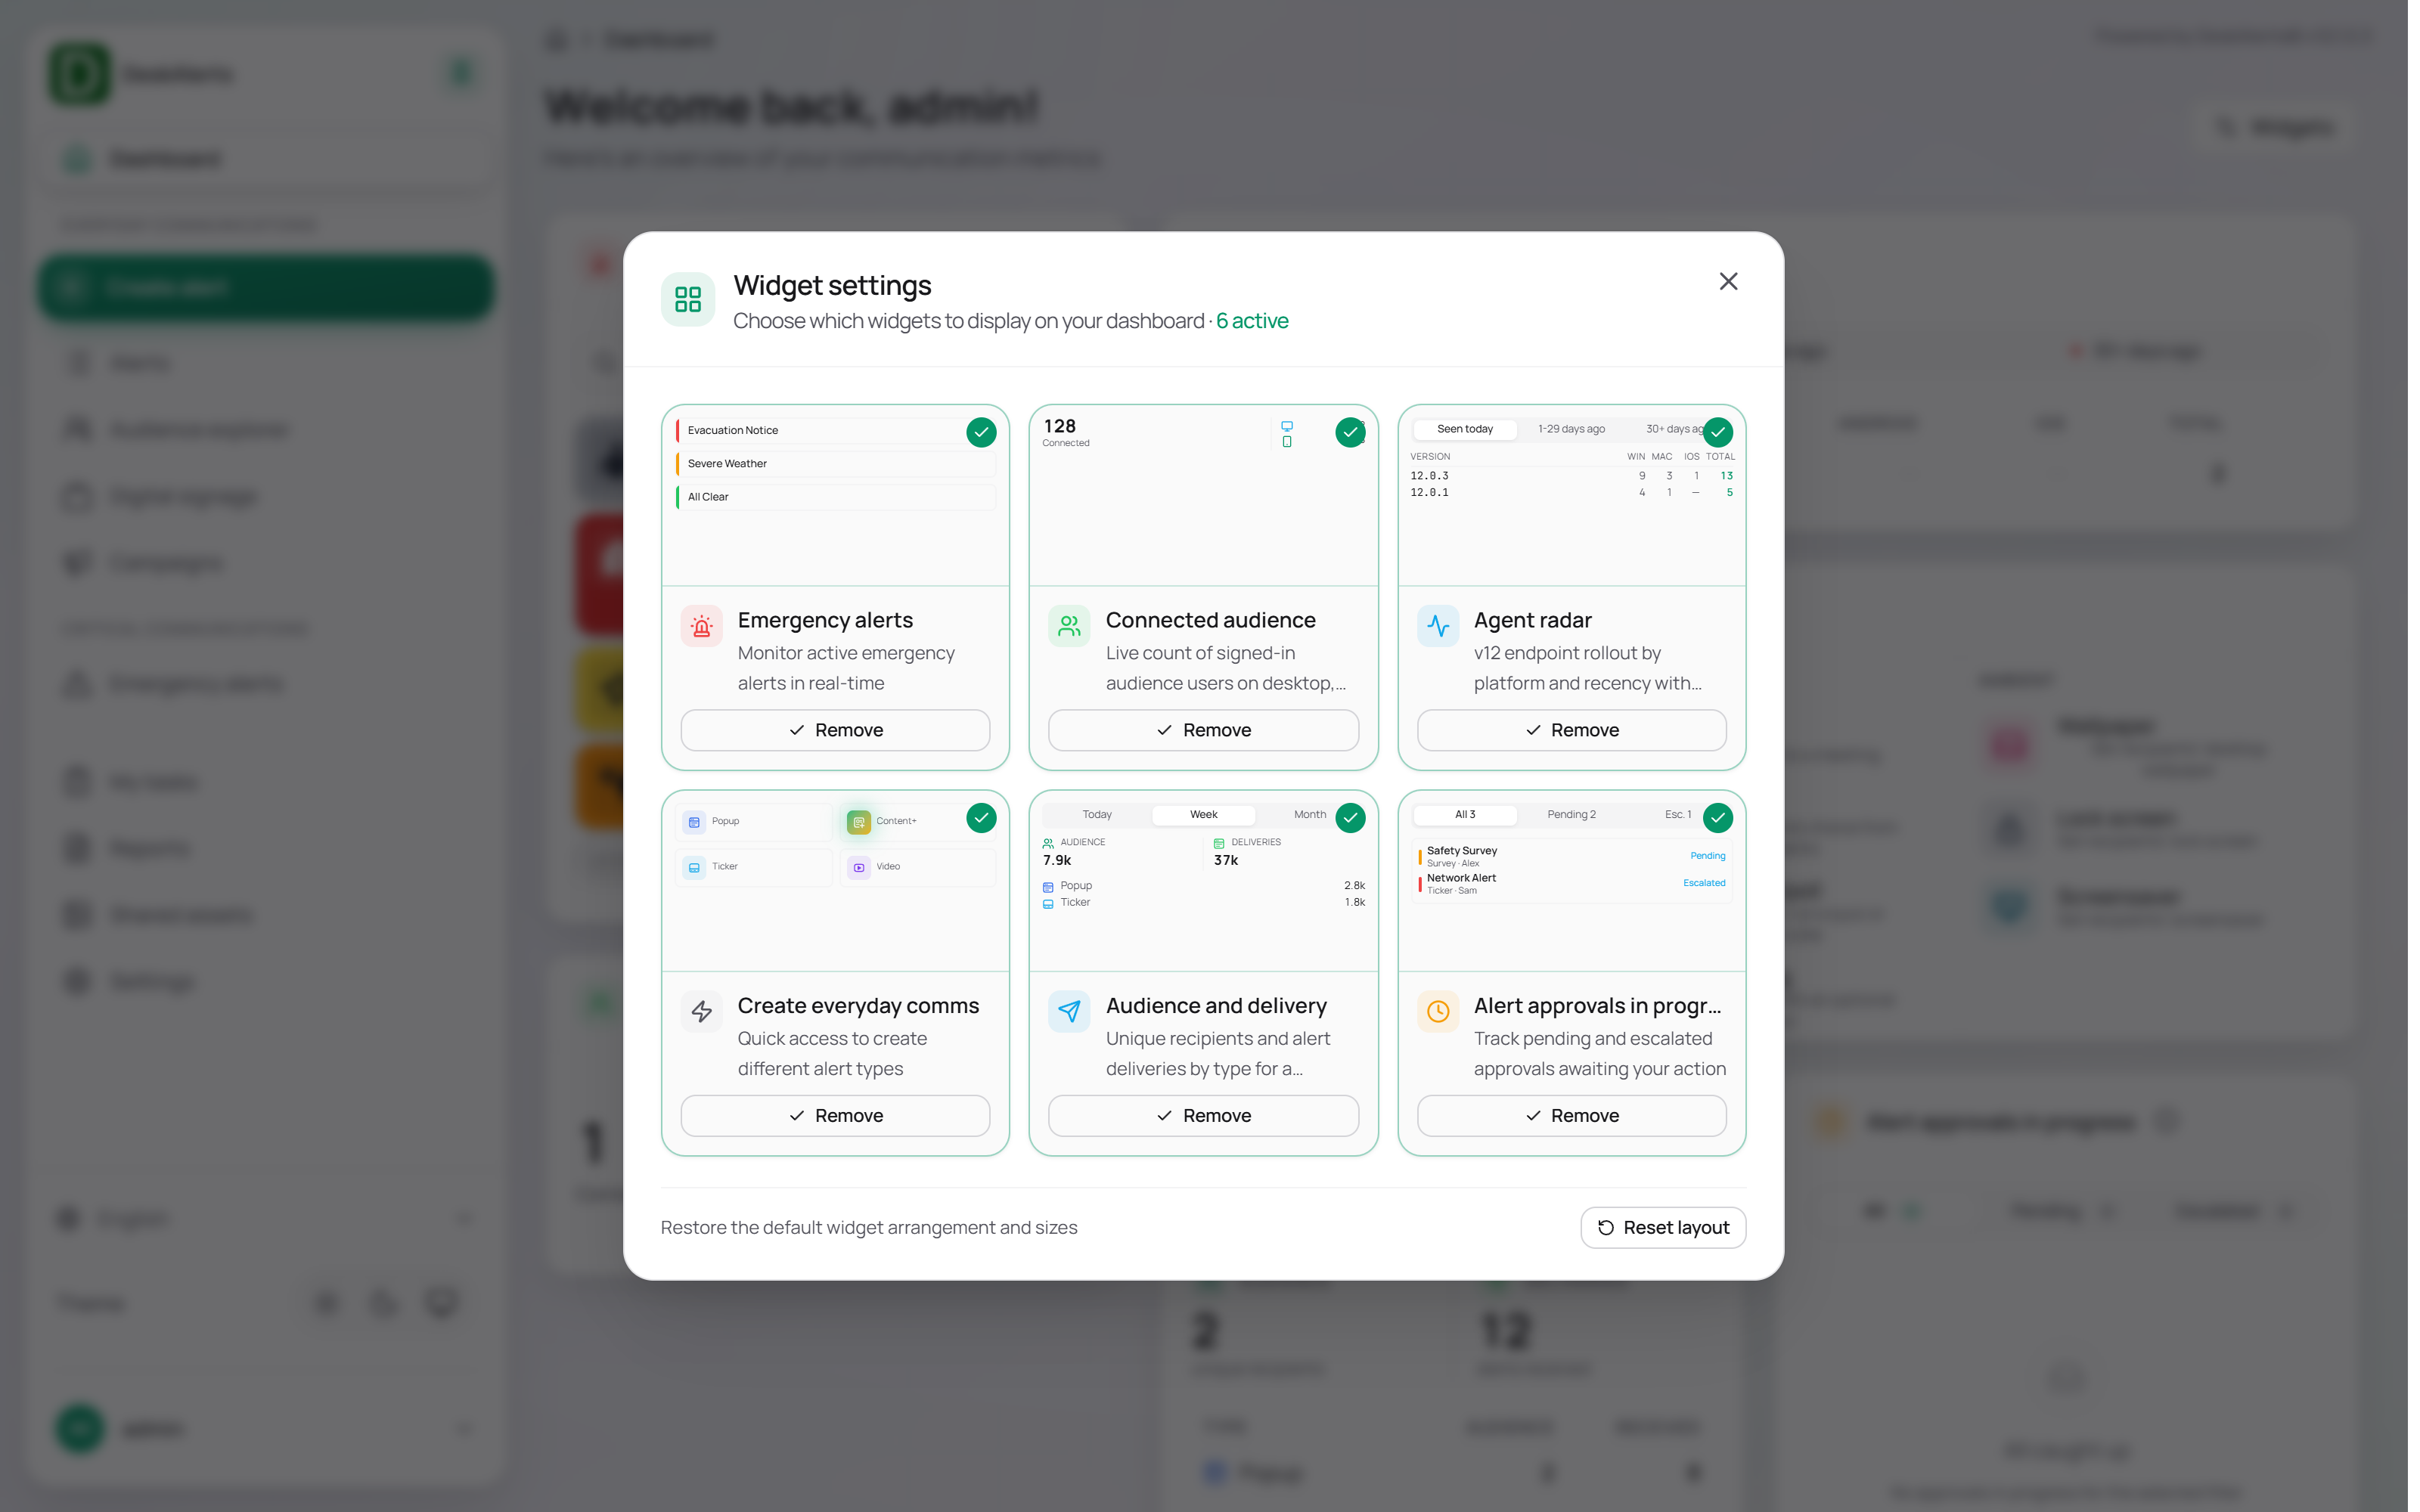 The Widget settings dialog with all six widgets enabled
Arranging widgets
Drag a widget by its title bar to move it; the other widgets move to make room. Widget selection and arrangement are saved for your web-portal user account.